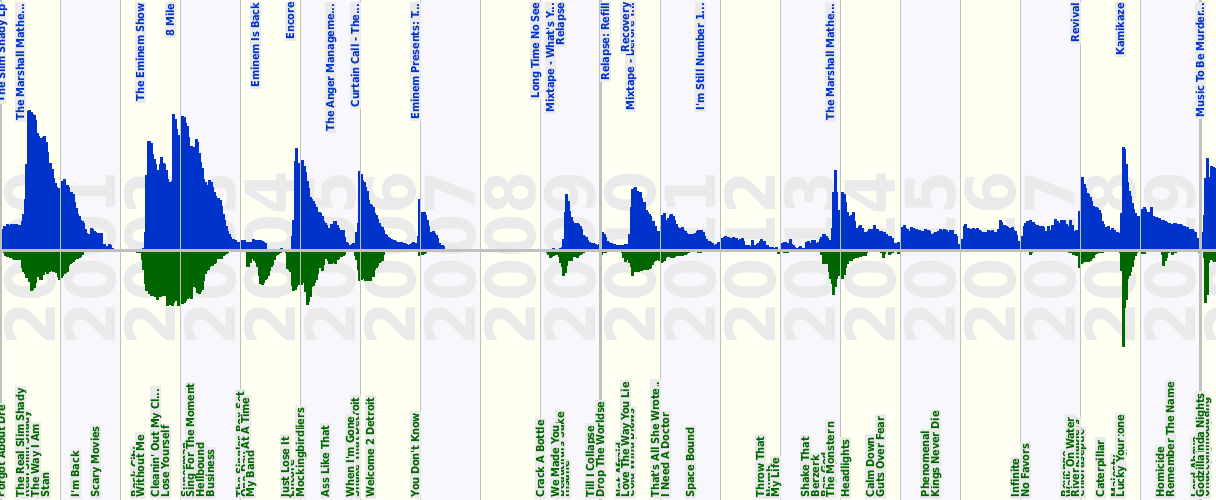
MusicID turns data into infographics which make it easy to tell a story.
Like the industry itself, MusicID moves with the times, now representing a universe of more than 300 million rows of data representing 74 countries, updated every week.
This data can be mined, refined and illustrated with state-of-the-art visualisation tools to provide the most cogent research presentations.
We have over 95% retention rate for our existing clients due to the value they are seeing for their students. This is an example of MusicID Revenue, which shows infographics and actual revenue of Eminem recordings. Clicking the particular Albums and Recordings shows the infographic in detail for that item.
http://revenue.musicid.academicrightspress.com/tt/eminem.htm

MusicID provides researchers with sophisticated infographics and authoritative data, making it an essential tool for advancing new insights and ideas.
This is the quick video showing the Indicative Revenue of albums and singles since 2000 covering the CD, download and streaming eras.
https://youtu.be/4MLUPjy_0yE
Individuals can subscribe to MusicID as well as librarians. Simply click here to get access https://www.academicrightspress.com/individual-subscriptions


